Introducing the Aligned Data Matrix

Money matters. But money alone doesn’t guarantee better results.
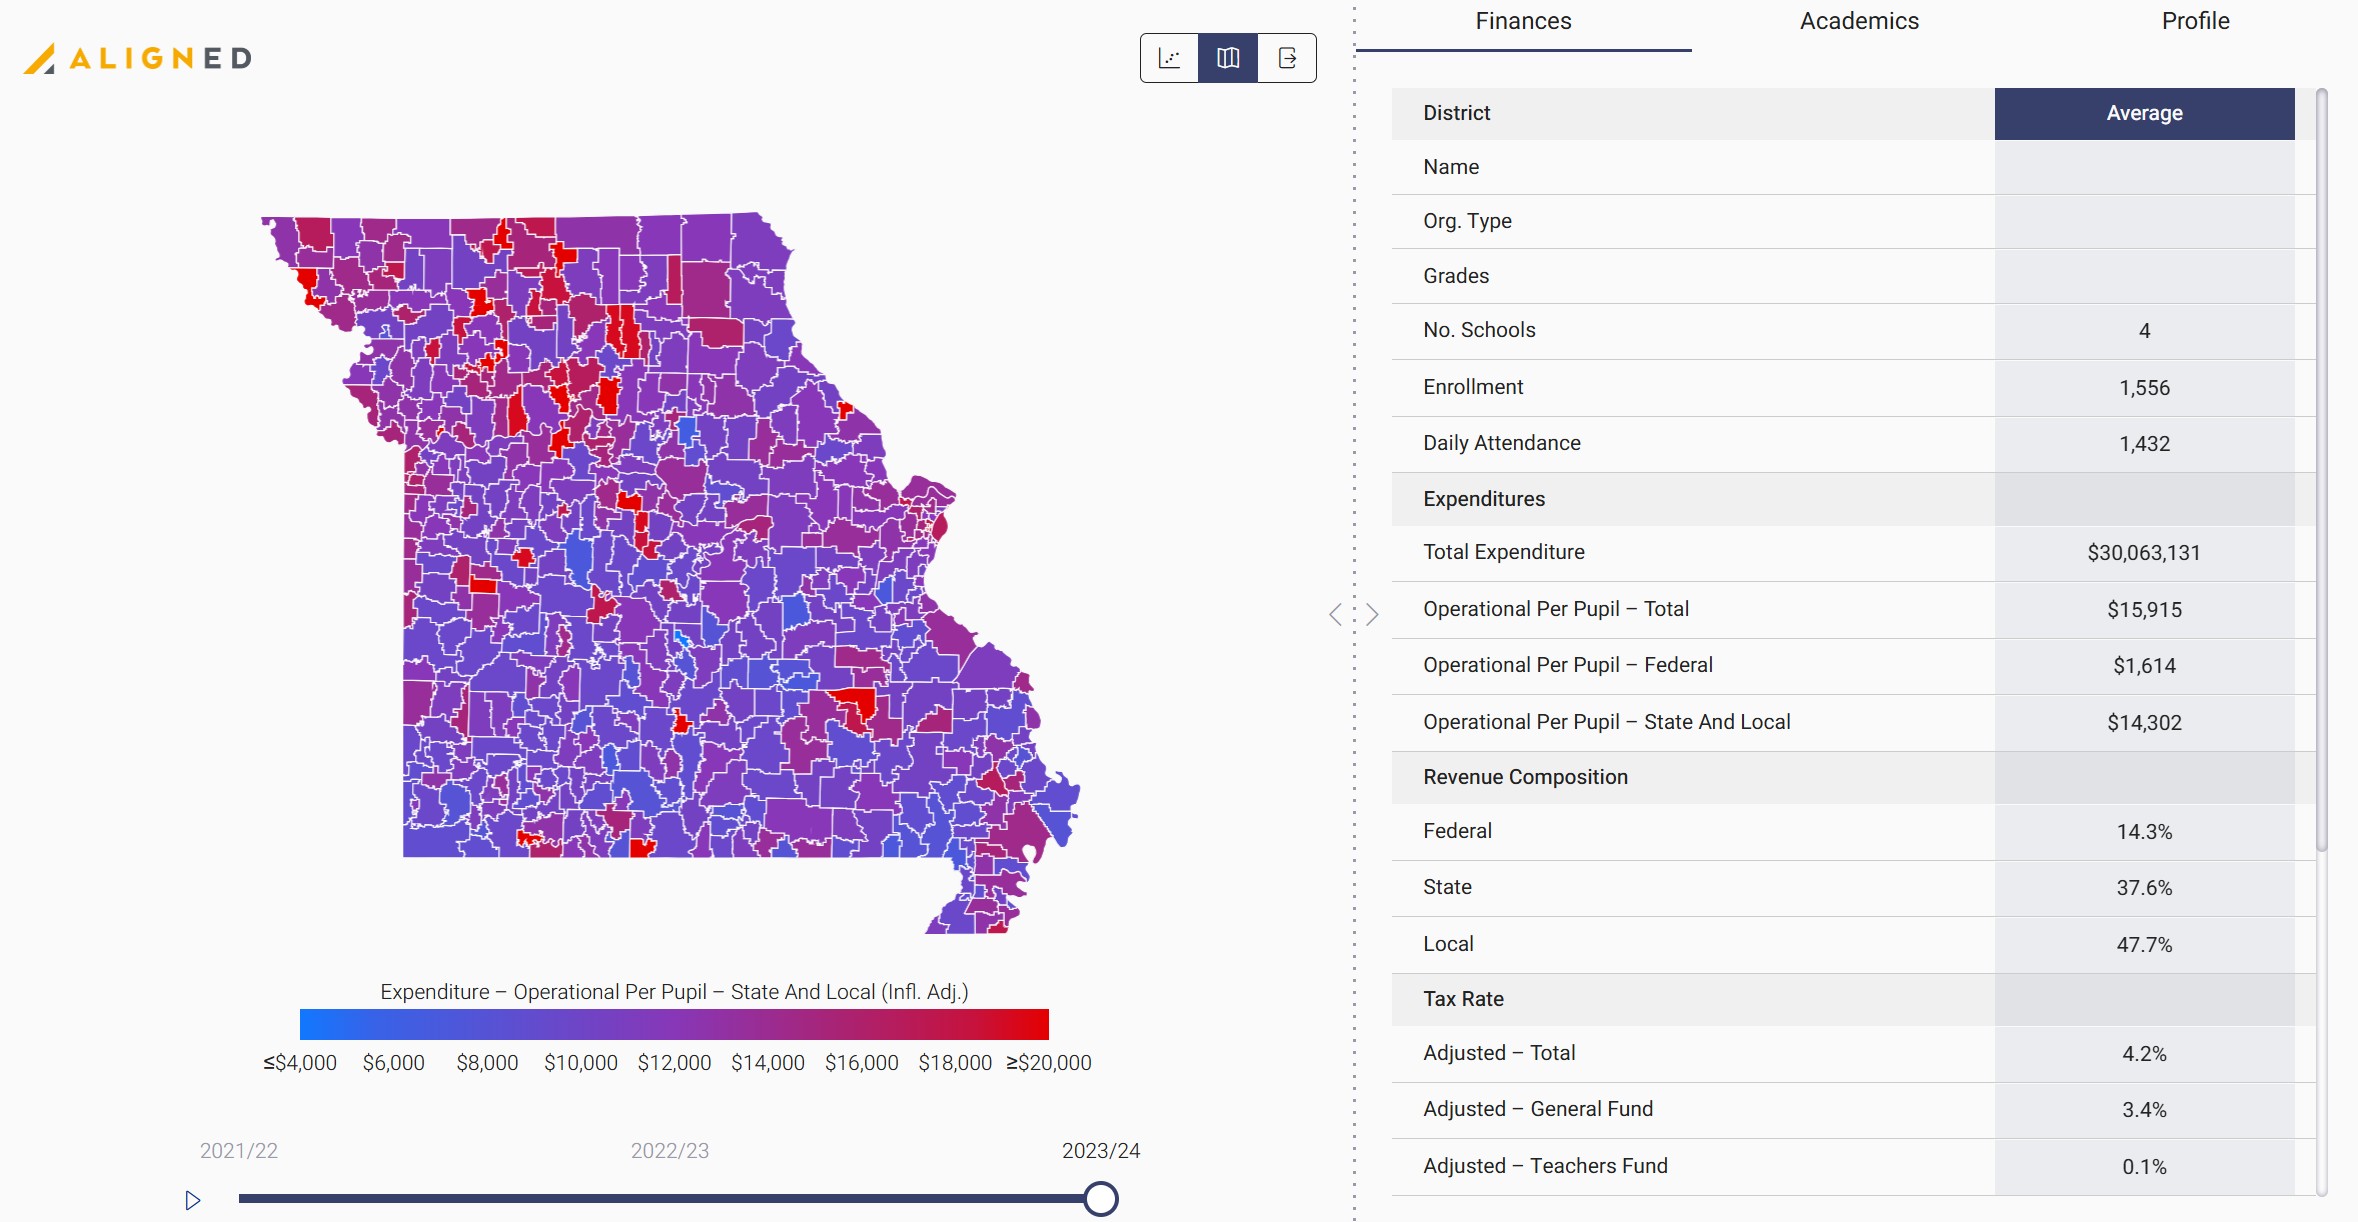
The Aligned Data Matrix is our education finance data hub that lets you compare funding and student outcomes across Missouri school districts, visualize patterns over time, and identify where investment and achievement diverge.
Use it to pressure-test assumptions, spotlight outliers — both bright spots and cautionary tales — and ask smarter questions about how to turn dollars into learning.
Explore the Aligned Data Matrix → Compare dollars and results, find outliers, and share insights with your team. Test it out here!
What you can do
- See the relationship (or lack of one): Plot per-pupil spending against outcomes to gauge how tightly dollars and results move together in your context.
Find outliers worth studying: Surface districts getting more out of each dollar — and those getting less — to guide follow-up.
Track change over time: Use trends to see whether new investments are translating into growth.
Slice by context: Filter by poverty, size, locale, and more to compare peers fairly.
Take it with you: Export cleaned data for deeper analysis or slide-ready visuals.
Correlation is not causation. Many factors influence academic achievement. The Matrix is a starting point for inquiry, not the final word. Use it to generate questions, then validate with local knowledge and program evidence. Try it out here.